Rocky Mountain Area Natural Gas Daily Price Review – February 2025
Brian Jeffries
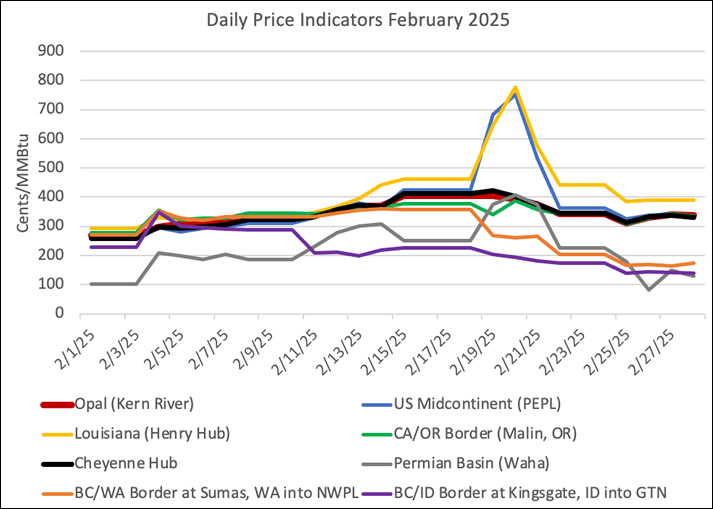
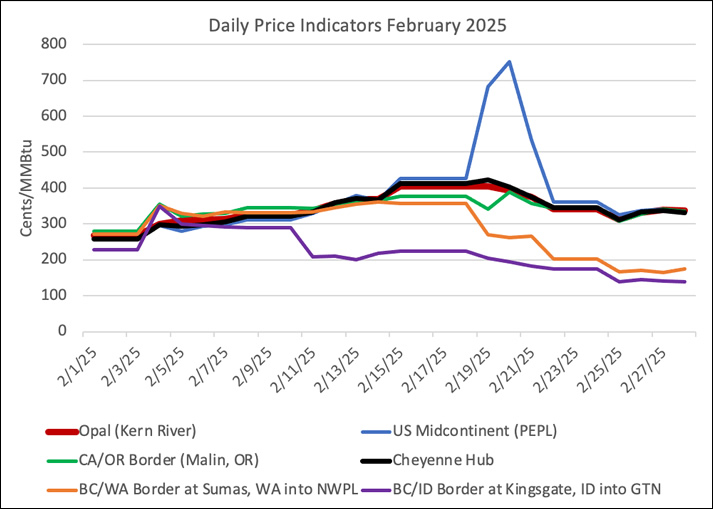
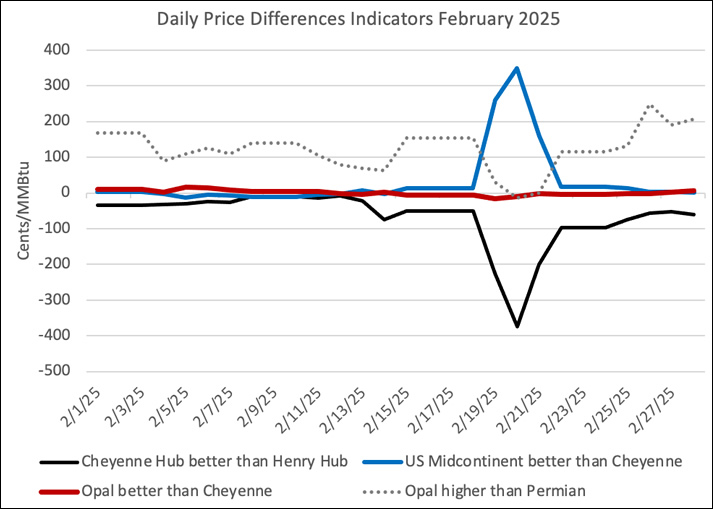
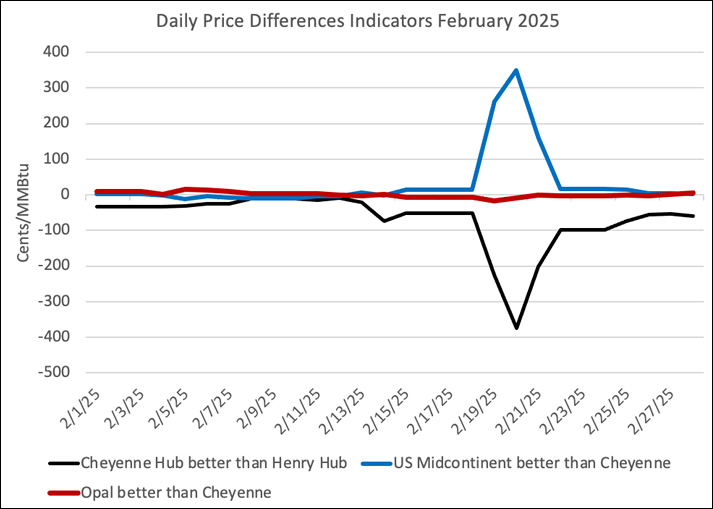
The charts below depict the daily cash price for natural gas at Opal and at the Cheyenne Hub for each day in February 2025. Also shown are prices at some key locaIons downstream from Wyoming going to the west and going to the midconInent region and the price for Waha, TX which represents the Permian Basin. A brief run of very cold weather post President’s Day ran prices in the Midwest US up but that price runup did not extend back to the Rockies producIon areas.
Because spot prices in the Permian Basin are so far below prices in the Rockies, there are four versions of the typical monthly price charts. This was done to provide charts with and without Permian Basin prices represented in the charts. The wide difference between Permian Basin prices and the other depicted prices compresses the y-axis when Permian Basin prices appear on the same chart as Rockies Prices. That compression makes it harder to see differences between points in the Rockies.
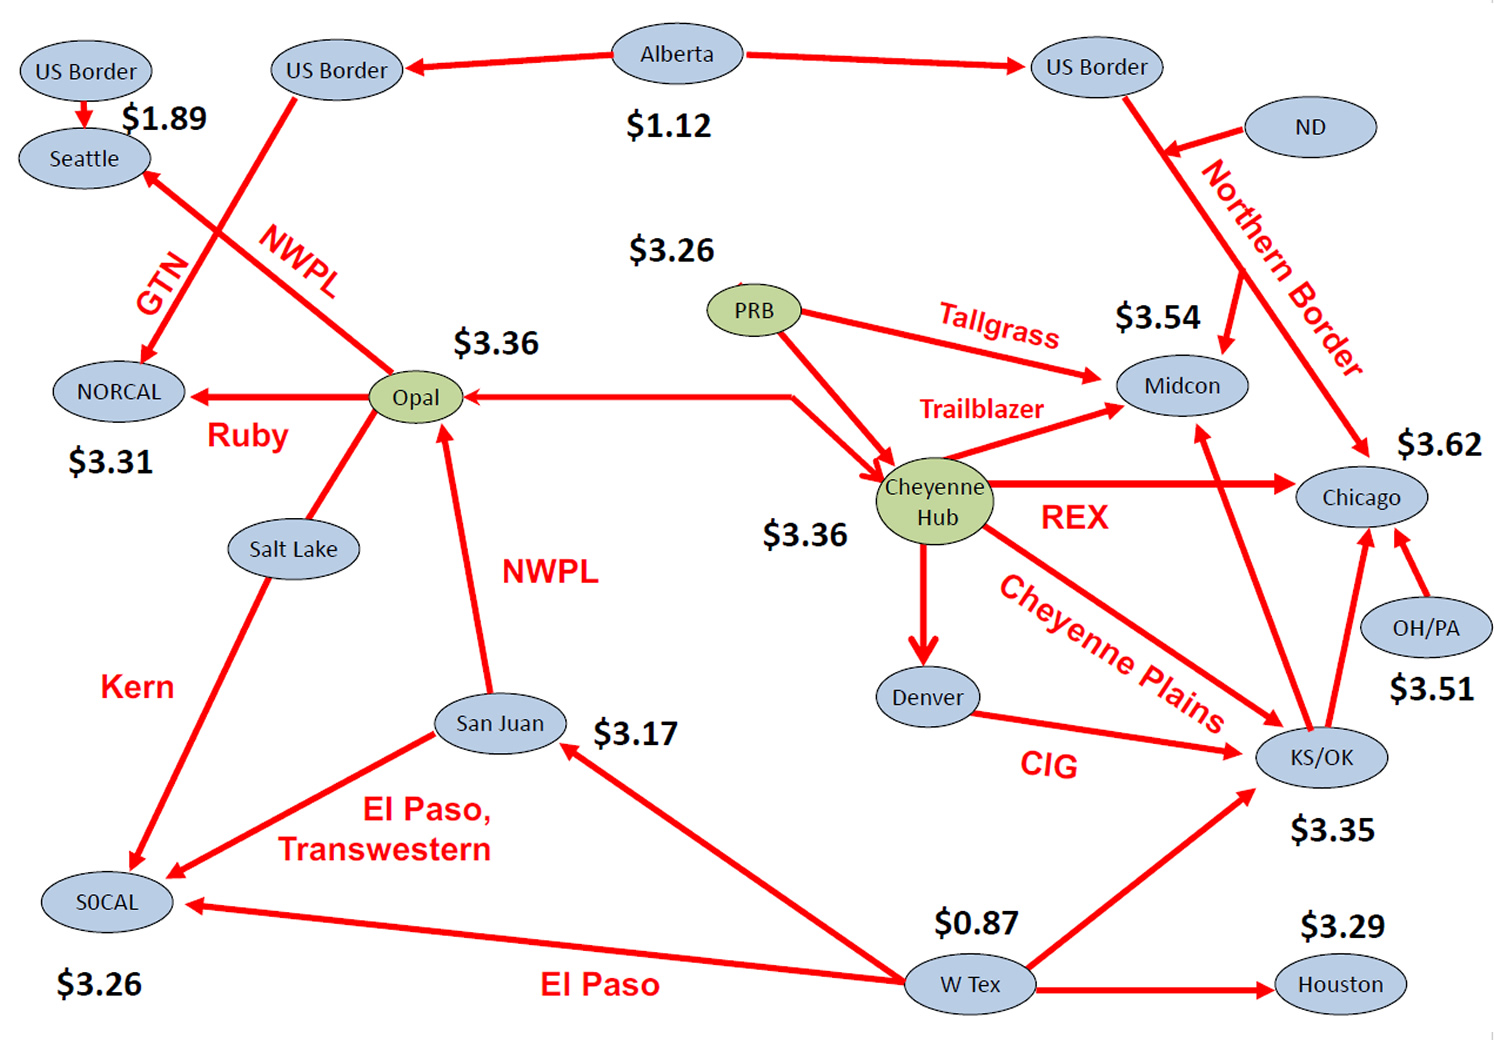
Representative pricing for baseload gas at points on the grid (US$/MMBtu) – March 2025